Color Properties: Colorbar/Histogram
The Colorbar/Histogram page is used to modify the colors of the ribbons
drawn on your Basemap. There is a histogram of all of the displayed
ribbon values on the Basemap. If more than one ribbon is displayed on
the map, they will share the colorbar and histogram. To quickly access
this window, you can right mouse click on the Colorbar Dialog and
select Properties, or use the icon on the Ribbon Toolbar.
-
Turn off Automatic range.
- Either:
- type in a maximum and minimum value in the fields, or
- left click on the histogram to start selecting a range and
while holding down, drag and release at the end of the range. The
maximum and minimum values will update in the boxes.
Note: You can set a user defined range directly from the Colorbar active dialog.
-
Click
 to see the
colorbar applied to the map.
to see the
colorbar applied to the map. -
Select a palette to see a histogram using the selected palette.
-
Use the drop down below the displayed palette to switch to another.
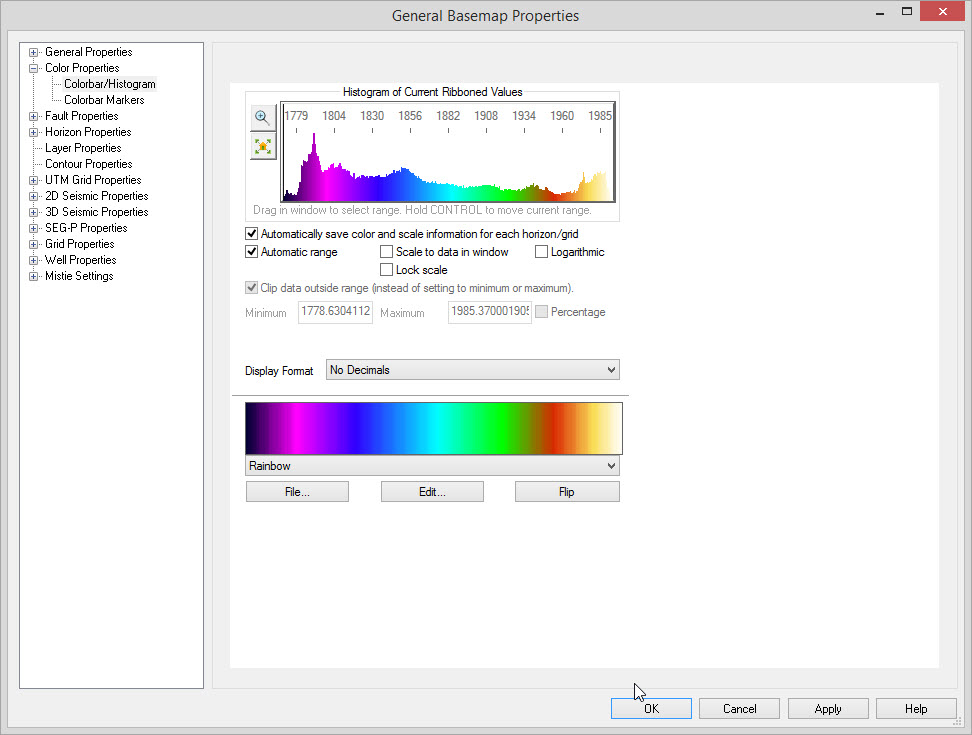
Colorbar Parameters
Automatic range: Turning this on will cause the scaling to automatically be determined based on values present in the ribbons displayed (as defined by the settings).
Scale to data in window: If selected, the scaling will ignore data outside the current Basemap view. As you scroll from one area to another, the scaling will update. Note: Turning on this option causes the map to perform a little slower but the colors will typically have a higher contrast.
Lock scale: This will keep the current scaling and is to be used in conjunction with "Scale To Data In Window". If you see a scaling that you like, and you intend to work within that area, lock the scale to prevent changes in the scaling. Unlocking it will rescale to the new data within the window.
Logarithmic: Use logarithmic scaling for the colorbar. Useful for data with an exponential trend.
Clip data outside range (instead of setting to minimum or maximum): With this option on, any data outside of the current range will not be drawn. If not selected, data outside the current range will be drawn with the colors at the extremes of the colorbar. To permanently delete data outside of the range, see the Clipping tool.
Minimum, Maximum: When using manual scaling (i.e. Automatic Range is off), these specify the extents of the range to use for scaling. You may also use the histogram to drag a range for scaling as described above.
Percentage: When specifying a minimum and maximum, use percentage values instead of actual values. Useful when changing between different horizons, but looking at just a small sub-range of values.
Decimals to Display
Colorbar Buttons
 File: Use
this to find a specific
colormap file that you have on your system that may not have been
included with the default palettes.
File: Use
this to find a specific
colormap file that you have on your system that may not have been
included with the default palettes. Edit: Launches the Color Palette Editor,
used to make changes to the current color palette or to create new ones.
Edit: Launches the Color Palette Editor,
used to make changes to the current color palette or to create new ones. Flip: This will flip the
actual
color palette. The colorbar will not flip (i.e. if small values
are at the top/left they will remain there).
Flip: This will flip the
actual
color palette. The colorbar will not flip (i.e. if small values
are at the top/left they will remain there).Also See
— MORE INFORMATION

|
Copyright © 2020 | SeisWare International Inc. | All rights reserved |